

Within the mind of financial analysts, how much consumers have paid for a certain product on average provides an important signal of how the product is doing in the market.
For Tesla, its current two models’ price lies in a wide range. For example, the Model S starts at the $66,000 (the 6o base trim) and goes all the way up to $161,750 when you pick the P100D trim with all option boxes checked.
Therefore an interesting question arises: how will a “normal” consumer option a Tesla? In other words: what is the typical price range that a Tesla buyer is looking at?
The average selling price can answer this question. For the term of “average selling price”, here the “price” means the price which is printed on the window sticker. It should not contain items such as the wall-mounted charger, any auxiliary options which is not installed/integrated into the vehicle, and also the prepaid service plans etc.
Tesla never publish this information to the public. However, it does not mean we are unable to get a rough estimate on the numbers. So in this article, we will show you how to calculate the approximate average selling price based on calendar years.
We will utilize Tesla’s annual report and quarterly report (2013, 2014, 2015 and 2016), which you can download from SEC’s website. Please note that we need to use both non-GAAP and GAAP data, because the information we need sits on both sides.
2013
R1 = Non-GAAP Automotive sales revenue (Vehicle, options and related sales) = $2,461,952,000¹
R2 = Sales of regulatory credits = $194,400,000
R3 = Sales of maintenance and service plans = $600,000
N = 2014 total delivery = 22,477 units
Approx. Selling Price (2013) = (R1 – R2 – R3) / N = $100,856.52
1: Non-GAAP revenue by adding “Net increase in deferred revenue and other long-term liabilities as a result of lease accounting and therefore not recognized in automotive sales” to the GAAP automotive revenue in the 2013 Q4 8-K form, Condensed Consolidated Statements of Operations chart
2014
R1 = Non-GAAP Automotive sales revenue (Vehicle, options and related sales) = $3,592,908,000²
R2 = Sales of regulatory credits = $216,300,000
R3 = Sales of maintenance and service plans = $3,000,000
N = 2014 total delivery = 31,655 units
Approx. Selling Price (2014) = (R1 – R2 – R3) / N = $106,574.25
2: Non-GAAP revenue by adding “Net increase in deferred revenue and other long-term liabilities as a result of lease accounting and therefore not recognized in automotive sales” to the GAAP automotive revenue in the 2014 Q4 8-K form, Condensed Consolidated Statements of Operations chart
2015
R1 = Non-GAAP Automotive sales revenue (Vehicle, options and related sales) = $4,986,489,000³
R2 = Sales of regulatory credits = $168,700,000
R3 = Sales of maintenance and service plans = $4,500,000
N = 2015 total delivery = 50,658 units
Approx. Selling Price (2015) = (R1 – R2 – R3) / N = $95,015.38
3: Non-GAAP revenue by adding “Net increase in deferred revenue and other long-term liabilities as a result of lease accounting and therefore not recognized in automotive sales” to the GAAP automotive revenue in the 2015 Q4 8-K form, Condensed Consolidated Statements of Operations chart
2016 (half year)
R1 = Non-GAAP Automotive sales revenue (Vehicle, options and related sales) = $2,955,247,000*
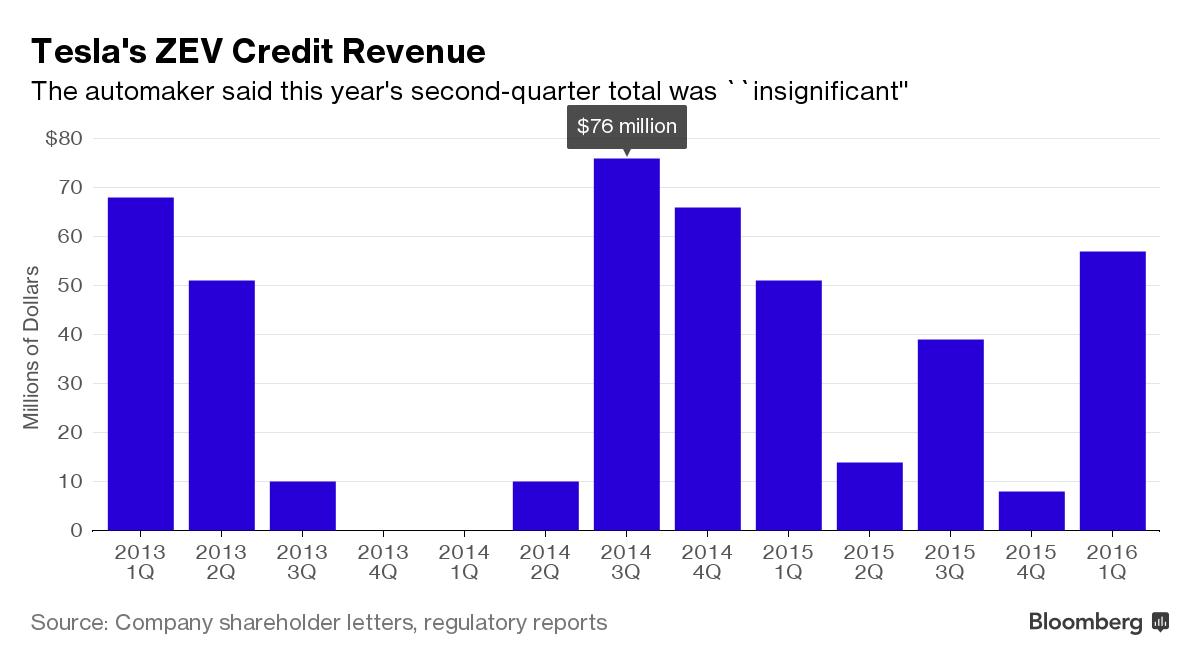
R2 = Sales of regulatory credits (1Q) = $57,000,000
Note: Q2 regulatory credits sales were so negligible compared to the total revenue, that Tesla did not list it separately in the Q2 report
R3 = Sales of maintenance and service plans = –
Note: Tesla did not publish this data in its reports
N = 2016 half year delivery = 29,190 units
Approx. Selling Price (2016) = (R1 – R2 – R3) / N = $99,289.04
*: Non-GAAP revenue by adding “Net increase in deferred revenue and other long-term liabilities as a result of lease accounting and therefore not recognized in automotive sales” to the GAAP automotive revenue in the 2016 Q2 8-K form, Condensed Consolidated Statements of Operations chart
Here is a summary of the average selling price (annually):
2013: $100,856.52
2014: $106,574.25
2015: $95,015.38
2016: $99,289.04ˆ
^: half-year data
Discussion and Analysis
1. In the above calculation, the “automotive sales revenue” may include the sale of pre-owned vehicles, which causes the total revenue to be greater than the actual new vehicle sales revenue. This means, the above calculated average price may be overestimated.
2. The above average price does NOT mean Tesla cars sold in the US are carrying such similar average selling price.
Reason is: European and Asia region sales take up close to 50% of Tesla’s global sales (out of the 50,658 total deliveries in 2015, 23,008 units were sold in Europe and Asia). Due to import taxes and other conditions, Tesla cars with the same options sold in Europe and Asia are typically more expensive than in the US (when converted back to US currency). For example in 2015, the Model S P85D – when it is equipped as $105,670 in the US, you need to pay £79,080 in UK to get the same car. Using the GBP/USD exchange rate back in 2015 this is equivalent to more than $122k.
Therefore, the higher pricing outside of the US market inflated the average selling price considerably.
3. Some revenue components, which do not belong to the vehicle itself (for example garage-mounted chargers etc.), are not separately listed in the reports. Hence there is no way we can adjust it accordingly and get the “most accurate” automotive sales revenue. This indicates the number we have calculated above may be overestimated in this aspect as well.
4. The average selling price was dropping between 2014 and 2015, which may be attributed to multiple factors: (a). more people favor the lower-power/lower-optioned trims rather than the high performance range topper; (b). foreign currency exchange rate fluctuations; (c). Discount on sales of the showroom/loaner vehicles.
5. The higher pricing in 2016 is due to the initial delivery of the Model X, which happened to be the most expensive full-loaded units whose MSRP is more than $130k.
6. Tesla stops to report non-GAAP result starting Q3 2016, therefore in the future we may not be able to calculate the average selling price anymore.

")
